
 ,


1 | INTRODUCTION
Quality refers to the standard by which garments are evaluated based on factors such as durability, fabric, and design. A garment’s quality often determines whether consumers keep or dispose of it, with poor-quality items leading to early disposal (Degenstein et al., 2020). Thus, fashion designers must apply their skills in garment quality assessment to produce sustainable clothing. According to Amankwa et al. (2015), skills are the ability to perform tasks expertly and systematically, which is critical in ensuring the longevity and sustainability of clothing. Quality control in garment manufacturing is vital for producing high-quality products, which influence the durability and overall sustainability of the final product (Rahman, 2009). However, some researchers argue that current trends in fashion place little emphasis on garment quality (Connor-Crabb & Rigby, 2019). Sustainable fashion, which prioritises reducing the environmental, social, and economic costs of clothing production, is central to the sustainability movement in the fashion industry (Ertekin & Atik, 2014). Consumers’ knowledge of the effect of waste on the environment is influencing their decisions towards sustainable fashion (Schiaroli et al., 2024). Mandarić et al. (2022) identify that the sustainability of clothing concerning a particular brand is key in influencing their decision to buy a particular clothing. According to Zhang et al. (2021), consumers' knowledge of the sustainability of a particular clothing contributes decision to buy the clothing. Consumer awareness of the quality of clothing contributes to influencing the patronage of clothing and has the potential to make clothing sustainable (Ng, 2020). Bonelli et al. (2024) opine that the global discussion on fashion and innovation is directed towards achieving sustainable fashion.
Yet, there is limited research on how fashion graduates apply their training in garment quality assessment to meet the demands of sustainability in the global fashion market. Challenges faced with garment quality assessment have been attributed to the assessment of technology and equipment. The influence of fashion education curricula on garment quality assessment by graduate fashion students has not been extensively studied. An examination of how fashion education curricula impact graduate fashion students’ ability to assess garment quality would provide information on aspects of fashion education curricula that need attention to improve garment quality assessment. This study, therefore, examines how the quality assessment knowledge gained by graduates of Accra Technical University contributes to sustainable fashion practices. The study was restricted to some aspects of garment quality taught to students at Accra Technical University. Responses from the study were limited to graduate students who completed between the years 2015-2020.
1.1 | Literature Review
1.1.1 | Quality Issues in Garment Production
Using data from several research initiatives commissioned by WRAP and Defra,
Cooper and Claxton (2022) report on a survey that found various types of garment failure by evaluating discarded items at the end of their life, discussing the causes of such failure, and suggesting potential remedies. According to the poll, colour fading and pilling are the most frequent reasons why clothing fails. Fabric deterioration, unintentional damage, loss of dimensional stability, logo failure, discolouration, and seam holes were further causes. Following technical guidelines for best practices can increase the longevity of clothing, but it also necessitates efficient management of the production and product development processes. Appropriate testing, enhanced technical expertise, cooperation to advance better design practices, and new business models that support garment longevity are all necessary for the implementation of technical solutions
(Cooper & Claxton, 2022).
1.1.2 | Fabric Production Quality Assesment
The preproduction quality control process involves testing the fabric, accessories, closures, interlinings, sewing threads, and other design aspects before manufacturing the garment
(Nayak & Padhye, 2010). As explained, fabric can also be evaluated for comfort, colourfastness, and durability
(Nayak & Padhye, 2014).
1.1.3 | Factors Influencing Fashion Work Output
Technology factors: Technological developments in the fashion industry have always had an impact on how clothing is made, supplied, and delivered to customers. The growth of the Internet and improvements in communication technologies have enabled businesses to respond more quickly to the latest market impulses by enabling and speeding up the flow of information from new trends and brands from the customer to the merchant. Customers now have higher expectations as a result of these advancements since they are aware of the latest fashion trends, thanks to the media (Rinnebach & Richter, 2014).
Environmental Factors: Unpredictable occurrences such as floods, tsunamis, and droughts can hinder the maintenance of industrial infrastructure and the growth of cotton. Since a lot of stores shifted their manufacturing to "developing" countries in Asia (Joy et al., 2012). The fast and slow fashion trends that are currently ruling the fashion industry are examined by Chavan (2018). Of the two, the fast fashion model is the most well-known, but the slow fashion model is becoming more and more well-liked because it discourages the excessive and unnecessary use of clothing, which leads to problems with recycling and environmental hazards. To accomplish the ultimate goal of creating lucrative client relationships, he also looks at the internal and external factors that affect the business climate of the fashion sector, as well as methods for overcoming them (Chavan, 2018).
Technical skills:
Arasinah et al. (2014) examine the technical knowledge, abilities, and anticipated changes in the garment business over the next ten years. According to the findings of the interviews, drawing, designing, sewing skills, and computer proficiency are the technical skills that employers most value. They discovered that understanding current trends, fashion, and company strategy is knowledge of the desirable competency. The technical skills of the students studying Industrial Clothing Production in vocational high school are attempted to be illustrated by
Aisyah et al. (2018). According to their study's findings, students' technical proficiency in nine areas—such as pattern/maker knowledge, cutting, sewing/knitting, finishing, pressing, quality control, packing, and deliveries—indicates that they are generally proficient in the process of creating in the fashion industry.
1.1.4 | Finishing and Clothing Output
Sharma (2019) investigated the relationship between finishing (colourfulness, brightness, and sharpness) and how people perceive quality. Thirty people were enlisted for a psychophysical experiment, and a Likert scale was created. Participants were asked to score four fabrics according to the six aspects of image quality on a test form printed on four distinct textures and sheen combinations of fabric. The data was statistically examined, and the results show that consumers prefer fabrics with low texture and sheen and that image sharpness is the best image feature. The study also suggested that picture quality is subjective and observer-dependent and that the structural characteristics of fabrics or substrates may affect how well an image is viewed (Sharma, 2019).
Cooper and Claxton (2022) look at the level of information about garment failure that would be needed by businesses and policymakers who support longer garment lives. According to the data, the most common causes of clothing failure are colour fading and pilling. Failure of the logo, discolouration, collapse of the cloth, accidental damage, loss of dimensional stability, and seam gaps were further issues. Following technical best practice guidelines can result in more durable clothing, but doing so requires effective process management both throughout the product development and manufacturing stages. Implementing technical solutions calls for sufficient testing, improved technical know-how, cooperation to promote better design principles, and new business models that promote the longevity of clothing (Cooper & Claxton, 2022). Chowdhury (2018) looked at the effects of unique finishings on 100% cotton woven and knit fabrics. Different physical test outcomes demonstrated that both woven and knit materials are strongly influenced by various special finishes. This study was primarily concerned with the functional characteristics of cotton knit and woven fabrics. These characteristics were affected by chemical treatments, including paper touch, polyethene, polyurethane, wrinkle-free, anti-static, water-repellent, soft, and silky-soft finishes. Based on various finishes, there was no appreciable variation in GSM (grams per square metre).
1.2 | Conceptual Framework
The conceptual framework looks at all factors that contribute to the learning process in garment quality assessment at ATU, as shown in Figure 1. The conceptual framework sees the quality of lecturers, curriculum used, facilities at the ATU, and the behaviour of the fashion graduates from ATU to affect the quality of garment production education at ATU. The Quality Garment Production Education at ATU is seen to influence professional fashion designers from ATU. The professional fashion designer from ATU is seen to be affected by economic factors such as their access to capital and environmental factors such as the place in which they find their business located. The professional fashion designer from ATU also affects their pre-production, production and post-production quality assessment. The pre-production, production and post-production quality assessment also contributes to their business and environmental sustainability.
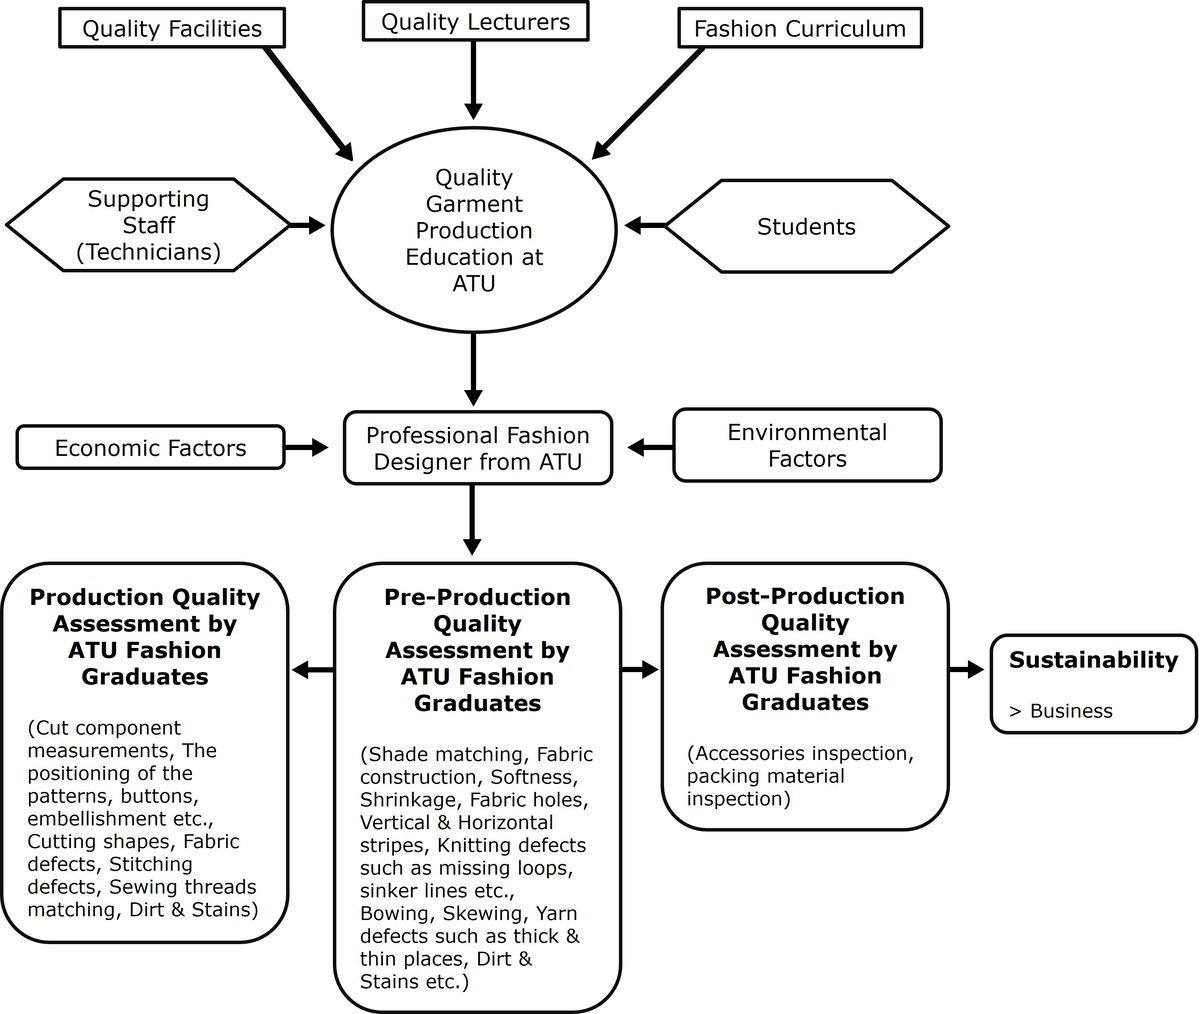
Figure 1. Conceptual Framework Researcher’s Construct.
2 | METHODOLOGY
2.1 | Research Design
This study used a positivist research paradigm, employing a quantitative research approach to examine the ability of Accra Technical University (ATU) fashion graduates to assess garment quality and its implications for sustainability. The study targeted fashion graduates from ATU who completed their program between 2015 and 2020. A field survey was conducted using questionnaires to gather data on their ability to evaluate garment quality, how this influenced their work, and how their knowledge contributed to sustainable fashion practices. Graduates' contact information was obtained from the Department of Academic Affairs. Those within the Greater Accra region who indicated their availability were selected for the study. A structured questionnaire was used to collect background information and assess the graduates' knowledge of garment quality assessment, including parameters such as fabric construction, fit, design, and overall aesthetic.
2.2 | Population of the Study
The population for the study included all fashion graduates from Accra Technical University who completed the program between 2015 and 2020. The total number of graduates was 1,437.
2.3 | Sampling Technique(s)/Size
Purposive sampling was used to select the fashion department graduates from ATU. Students were selected from ATU because that is one of the public institutions with the highest number of fashion students in the country. Accra also has several fashion designers compared to other parts of the country. Graduates were then grouped by year of completion and degree obtained using stratified sampling. From these strata, simple random sampling was used to select 210 respondents. The sample size was determined using a modification of Cochran’s formula to ensure statistical representativeness.
Table 1. Sample distribution for those who have completed the Accra Technical University from 2015-2020.
| Year | Population of Students who graduated | Sample | |||
|
|
HND | ST 1 BTech | ST2 Non HND | Total |
|
| 2015 | 108 | - | 21 | 129 | 19 |
| 2016 | 141 | 23 | 13 | 177 | 14 |
| 2017 | 253 | 20 | 15 | 288 | 22 |
| 2018 | 231 | 15 | 5 | 251 | 27 |
| 2019 | 231 | 26 | 23 | 280 | 28 |
| 2020 | 234 | 25 | 53 | 312 | 100 |
| Total | 1198 | 109 | 130 | 1437 | 210 |
2.4 | Data collection instrument and procedure
A structured questionnaire was used to obtain relevant information from the respondents. The questionnaire had questions which captured the biodata of the respondents. The questionnaire also captured information on the training received by the students and how this knowledge had impacted their ability to assess the quality of garments. The questionnaire had a Likert scale of 5 to 1 where 1= Does not apply, 2= Not important, 3= Somehow important, 4= Very important, 5= extremely important which tested their knowledge of quality parameters critical in pre-production, production and post-production of garments. The questionnaire was developed into a Google form and shared via WhatsApp with each respondent.
2.5 | Validity and reliability
The questionnaire was taken through a process where experts were consulted on the validity of the scales used and where some questions and scales were seen to be inadequate, a review of such questions and scales was done until the final questionnaire was developed. The method adopted was compared with other established methods, data sources and theories to obtain an adequate understanding research procedure. The questionnaire was also pretested before it was used.
2.6 | Data Analysis
Descriptive statistics, including frequency distributions, percentages, and measures of central tendency (mean, median), were calculated using SPSS version 20. The results were visualized through bar charts and graphs to enhance clarity.
2.7 | Ethical Considerations and Approval
Ethical approval was obtained from the Ethical Board of Accra Technical University before the study commenced. All participants were assured of confidentiality and anonymity. Informed consent was obtained from all participants before data collection, and ethical processes were strictly followed throughout the study.
3 | RESULTS AND DISCUSSION
3.1 | Background Characteristics
The results of the background characteristics of the study show that the majority of the respondents (70.8%, n=149) are females, with a few being males, as can be seen in Figure 2(a). The results imply that more females than males enrolled on the program from 2015 to 2020. This is indicative that more females prefer to study fashion design compared to males. It consequently implies that most of the fashion designers who practice are mostly females compared to males. Studies by
Antiaye et al. (2013) on the competence/skills acquired by students in fashion design concerning the performance expectations of the fashion industry from 1995 to 2010 obtained respondents which comprised 33 males and 107 females from ATU, indicating more females enrolling in fashion design at ATU compared to males.
Damalie et al. (2019) also undertook a study to seek feedback from Technical University HND Fashion Students in identifying work experiences fashion students acquired during the S-O IA programme. They sampled 105 students from the ATU and obtained responses from 14 males and 77 females, also showing a higher enrolment for females compared to males at ATU. Also, it was observed that the majority of the respondents (54.5%, n=114) were also identified to be within the age range of 21-25 years, with just a few being 36 years and above, as can be seen in Figure 2(b).
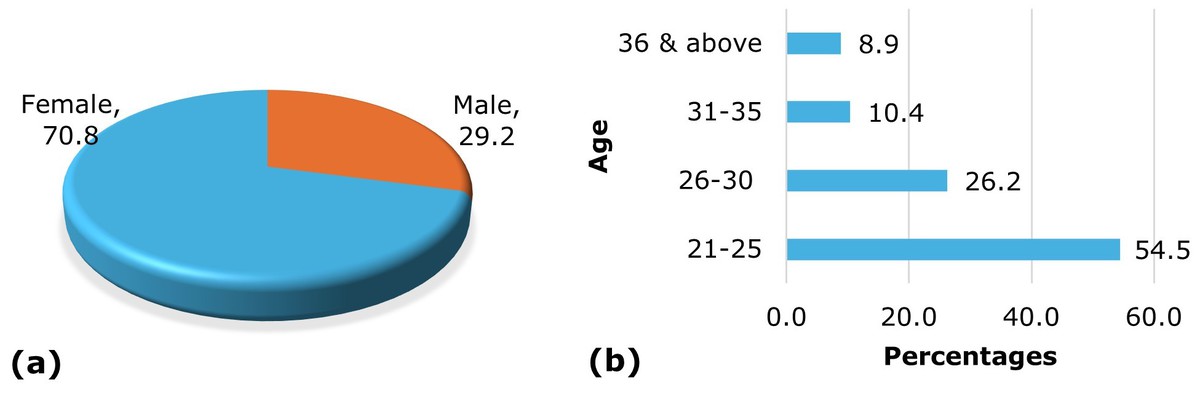
Figure 2. (a) Gender Distribution of Fashion Graduates (2015-2020), (b) Age Distribution of Fashion Graduates (2015-2020). Sample size 210.
The results from the age distribution of the graduate fashion students from ATU indicate that most of the students enrolled in the fashion program after completing the second cycle of education. This is because most Ghanaians complete the second cycle of education at age eighteen and enter tertiary education after that age. This could also mean that the urge to learn fashion design is stronger among younger people compared to the elderly. This might be the level of stress associated with the learning of the fashion course.
Most of the respondents (90.1%, n=190) were also observed to be Christians, with a few being Muslims. The results on religion distribution and marital status implied that most Christians enrolled on the fashion program at ATU. Also, most of the single people enrolled on the fashion program at ATU. This observation could be due to the age at which most of them enrol on the program, and in Ghana, fewer people get married at the enrolment age in the tertiary institution. The majority of the respondents (87.1%, n=184) were also identified to be single as compared to a few who were married. The majority of the respondents (62.6%, n=131) had the HND as their qualification in fashion, with a few having a Btech degree (Figure 3a). The majority of the respondents (48.6%, n=100) had completed in the year 2020, with a few completing in the year 2017 (Figure 3b).
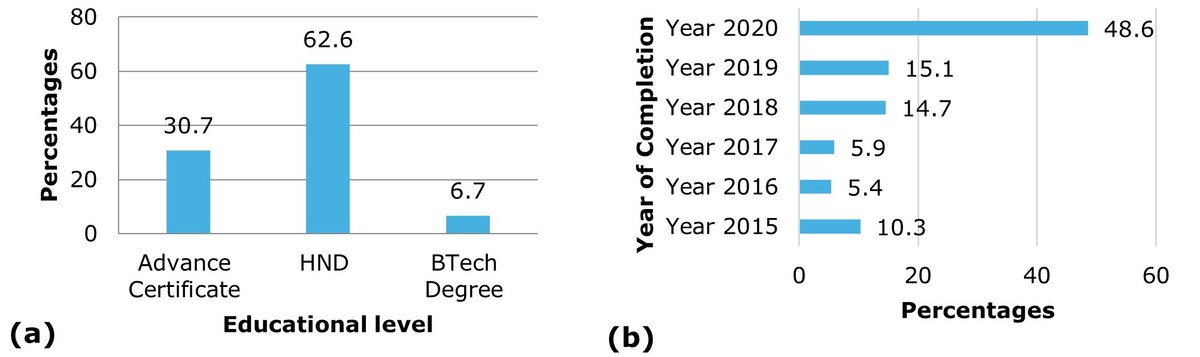
Figure 3.
(a) Level of education of Fashion Graduates (2015-2020) (b) Year of completion of Fashion Graduates (2015-2020).
3.2 | Association between gender, religion, educational level and enrolment in fashion programs
A Chi-square test was conducted to assess if gender distribution in the fashion program at ATU significantly differs from other programs. The results indicate a stronger but not significant association (𝛘 2=5.735, p=0.333) between gender and enrolment in fashion programs (Table 2). This shows that there is gender disparity with the number of fashion students enrolled in ATU each year, over the period examined with more females enrolling each academic year. The strength of the gender difference in the sample was weak and also not significant (Cramer's V =0.172, p=0.333). The Gender disparity among students who enrolled in the fashion program at ATU over the period examined was, however, small as well as significant. One such inequity that has defined higher education enrollment in Ghana is gender-based disparity (Quarshie et al. 2023). As of 2018, the data demonstrates consistent trends of inequality in Ghana's tertiary institutions of all kinds (Quarshie et al. 2023).
Table 2. Association between gender and enrolment in fashion programs of Fashion Graduates (2015-2020).
|
Gender
(N=210) |
Year of Completion | 𝛘 2 | Sig. | Cramer's V | Sig. | |||||
|
|
2015 | 2016 | 2017 | 2018 | 2019 | 2020 | 5.735 | 0.333 | 0.172 | 0.333 |
| Male (n=61) | 7 | 4 | 9 | 5 | 11 | 25 |
|
|
|
|
| Female (n=149) | 12 | 10 | 13 | 22 | 17 | 75 |
|
|
|
|
| Total | 19 | 14 | 22 | 27 | 28 | 100 |
|
|
|
|
A Chi-square test was also conducted to assess if religion distribution in the fashion program at ATU significantly differs from other programs. The results indicate a weak and non-significant association (𝛘 2=3.683, p=0.596) between gender and enrolment in fashion programs (Table 3). This shows that the number of fashion students enrolled in ATU each year, over the period examined, was not influenced by the religious background of the students who enrolled in the fashion program. The strength of the religion distribution difference in the sample was weak and also not significant (Cramer's V =0.132, p=0.596). The disparity in the religious background of the students who enrolled in the fashion program at ATU over the period examined was minimal and not significant. Opoku et al. (2015) underscores the importance of religious affiliation in education enrolment, especially at the tertiary level.
Table 3. Association between religion and enrolment in fashion programs Fashion Graduates (2015-2020).
| Gender (N=210) | Year of Completion | 𝛘 2 | Sig. | Cramer's V | Sig. | |||||
|
|
2015 | 2016 | 2017 | 2018 | 2019 | 2020 | 3.683 | 0.596 | 0.132 | 0.596 |
| Christian (n=190) | 18 | 14 | 21 | 23 | 25 | 89 |
|
|
|
|
| Muslim (n=20) | 1 | 0 | 1 | 4 | 3 | 11 |
|
|
|
|
| Total | 19 | 14 | 22 | 27 | 28 | 100 |
|
|
|
|
A Chi-square test was also conducted to assess if the educational level in the fashion program at ATU significantly differs from other programs. The results indicate a strong and significant association (𝛘 2=18.908, p=0.041) between educational level and enrolment in fashion programs (Table 4). This shows that there are variations in the level of the fashion program for the number of fashion students enrolled in the ATU each year over the period examined, with more fashion students enrolling in the HND program each academic year. The strength of the educational level difference in the sample was weak but significant (Cramer's V =0.212, p=0.041). Variation in the educational levels for enrolled in the fashion program at the ATU over the period examined was minimal but significant over the period examined. Amankwaa et al. (2020) identify that there are differences in enrollment levels for programs at the tertiary level of education, with this difference being informed by High School subject combinations, personal interests, career preference, and work opportunities. There are differences in enrollment levels for programs at tertiary institutions in Ghana (National Accreditation Board, 2020).
Table 4. Association between educational level and enrolment in fashion programs Fashion Graduates (2015-2020).
| Educational Level (N=210) | Year of Completion | 𝛘 2 | Sig. | Cramer's V | Sig. | |||||
|
|
2015 | 2016 | 2017 | 2018 | 2019 | 2020 | 18.908 | 0.041 | 0.212 | 0.041 |
| Advance Certificate (n=65) | 7 | 3 | 4 | 3 | 9 | 39 |
|
|
|
|
|
HND (n=131) |
11 | 9 | 15 | 24 | 19 | 53 |
|
|
|
|
| BTech Degree (n=14) | 1 | 2 | 3 | 0 | 0 | 8 |
|
|
|
|
| Total | 19 | 14 | 22 | 27 | 28 | 100 |
|
|
|
|
A one-way ANOVA was used to test for age differences across different educational qualifications. The analysis revealed that the age distribution between the two groups was statistically significant (p < 0.05) (Table 5), indicating that there is a significant variation with age across the different educational qualifications. This shows that students within different age brackets enrolled at different levels of enrolment for the fashion course at ATU. The correlation between age differences across different educational qualifications was statistically significant (p < 0.05). This implied that the students in different age brackets enrolled at different levels of enrolment for the fashion program at ATU over the period examined, with the differences in age brackets increasing as students enrolled in higher degrees in the fashion department at ATU. Insah et al. (2015) identify variations in the age of students across different levels of their study. Yusif and Ofori-Abebrese (2017) identify age variation to be associated with different levels of course studies within tertiary educational institutions.
Table 5. ANOVA table for age differences across different educational qualifications for Fashion Graduates (2015-2020).
| Educational Level (N=210) | Mean +SD | F | Sig. | Correlation coefficient | Sig. |
|
|
6.612 | 0.002 | 0.214 | 0.002 | |
| Advance Certificate (n=65) | 2.57 +0.98 |
|
|
|
|
|
HND (n=131) |
2.73 +0.89 |
|
|
|
|
| BTech Degree (n=14) | 3.57 +1.16 |
|
|
|
|
A one-way ANOVA was used to test for age differences across different years of completion. The analysis revealed that the age distribution between the two groups was statistically significant (p < 0.05) (Table 6), indicating that there is a significant variation with age across the different years of completion. This shows that students within different age brackets completed the fashion course for the different years of completion examined. The correlation between age differences across different years of completion was statistically significant (p < 0.05). This implied that the students in different age brackets completed the fashion course for the different years of completion examined with differences in age brackets reducing over the year on completion increased toward 2020. According to Cohen et al. (2022), there are age variations among students who complete the same program in tertiary institutions at different completion years.
Table 6. ANOVA table for age differences across different years of completion for Fashion Graduates (2015-2020).
| Year of completion (N=210) | Mean +SD | F | Sig. | Correlation coefficient | Sig. |
|
|
|
17.492 | <0.001 | -0423 | <0.001 |
| 2015 (n=19) | 4.05 +0.85 |
|
|
|
|
| 2016 (n=14) | 3.64 +1.08 |
|
|
|
|
| 2017 (n=22) | 2.95 +1.00 | ||||
| 2018 (n=27) | 2.41 +0.69 |
|
|
|
|
| 2019 (n=28) | 2.57 +0.74 |
|
|
|
|
| 2020 (n=100) | 2.44 +0.77 |
|
|
|
|